← Normative Predictions · Home · Exercise Prescription →
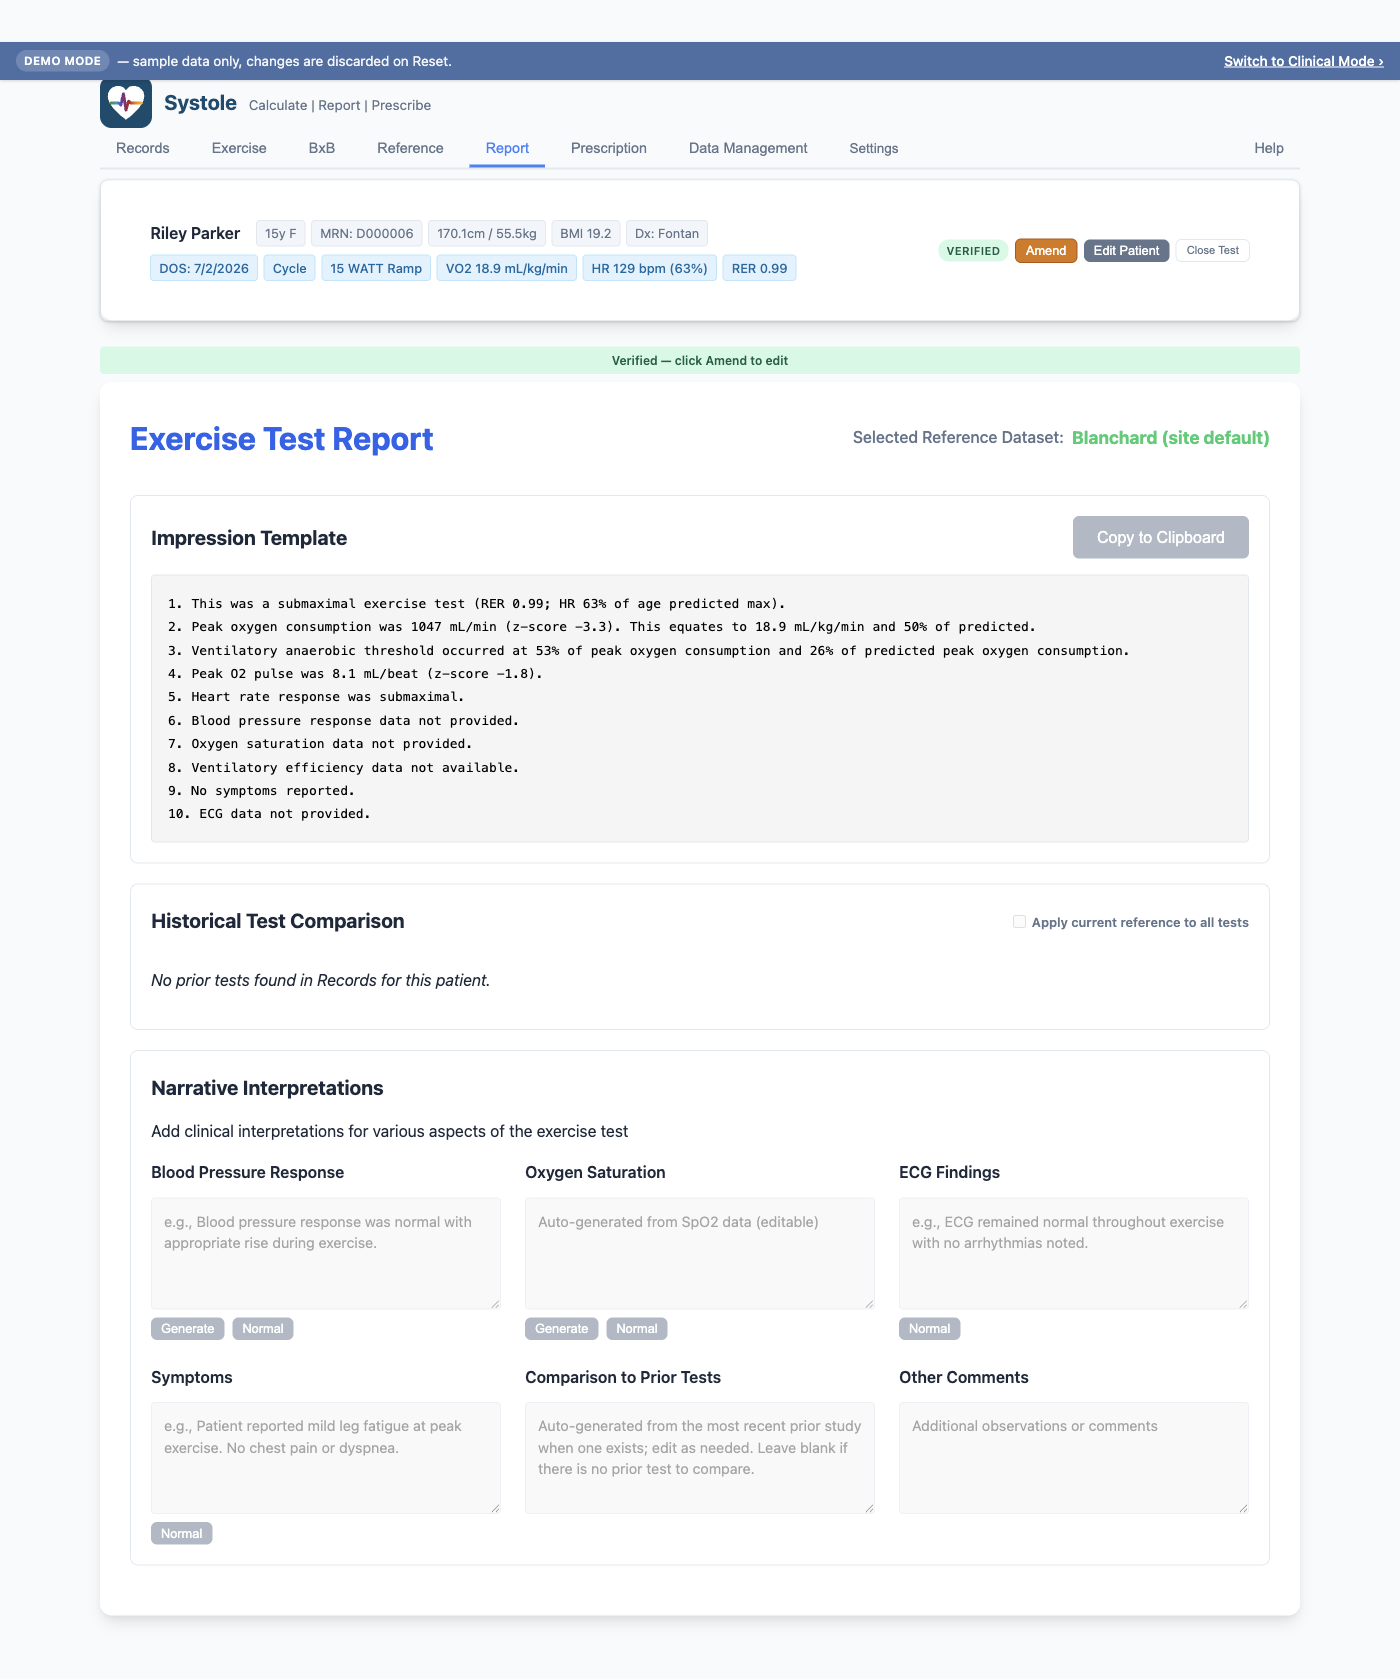
The Report tab generates a structured clinical impression and provides fields for narrative interpretation of the exercise test.
A badge at the top of the Report tab displays the currently selected reference equation (e.g., "Blanchard"). The badge also indicates whether the selection is explicit or falling back to the site default ("site default" tag).
To change the reference, switch to the Reference tab and click the Report radio button on the desired equation row. The Report tab updates immediately. If no equation is explicitly selected, Systole uses the site default configured in Settings — but the impression and trend charts still render normally.
Note on verified tests: clicking Verify snapshots whichever reference is currently displayed (explicit or site default) into the test record. Verified tests are immune to subsequent site-default changes — their impression continues to render against the snapshotted equation. To change the reference on a verified test, click Amend first.
Systole generates a numbered clinical impression based on the observed CPET data, selected normative reference, and the narrative fields below. For a full CPET (with gas exchange), the impression is structured as 10 or 11 items in this order:
Maximal test determination — Qualitative classification based on peak RER and percent of age-predicted max HR (220 − age). Possible outputs: "maximal exercise test by gas analysis" (RER ≥ 1.09), "maximal exercise test by heart rate" (RER < 1.09 but HR ≥ 85% of age max), or "submaximal exercise test" (neither threshold met). Includes the RER and HR percent in parentheses.
Peak VO₂ — Reports values only, no qualitative descriptor. Format: "Peak oxygen consumption was X mL/min. This equates to Y mL/kg/min and Z% of predicted." For Blanchard / Amedro references, a Z-score is added in place of the absolute-value parenthetical: "(z-score N)".
Anaerobic threshold — Reports values only. Format: "Ventilatory anaerobic threshold occurred at X% of peak oxygen consumption and Y% of predicted peak oxygen consumption." If AT cannot be determined, states so.
Peak O₂ pulse — Reports values only. Format: "Peak O₂ pulse was X mL/beat (Y% predicted)" or "(z-score N)" for Blanchard / Amedro.
Heart rate response — Qualitative classification: "normal" (HR ≥ 85% of age max), "chronotropic incompetence" (HR < 85% of age max with RER ≥ 1.09 indicating effort was adequate), "submaximal" (HR < 85% of age max with RER < 1.09), or "adequate" as a fallback.
Blood pressure response — From the narrative field below.
Oxygen saturation — From the narrative field below.
Ventilatory efficiency — Reports values only. Format: "Ventilatory efficiency (VE/VCO₂) slope from rest to peak was X" (with z-score for Blanchard / Amedro). The clinician supplies any qualitative interpretation in the comments narrative if desired.
Symptoms — From the narrative field below.
ECG findings — From the narrative field below; structured ECG findings from the Exercise tab are also incorporated.
Comparison to prior tests (optional) — From the narrative field below; appears only when populated.
For a graded exercise test without gas exchange (no peak VO₂), the impression is shortened to 7-8 items: max test, VO₂, HR, BP, SpO₂, symptoms, ECG, optional comparison.
Items #2, #3, #4, and #8 deliberately do not include qualitative descriptors (e.g., "mildly reduced", "early onset", "ventilation-perfusion mismatch"). They report measured and predicted values; the interpreting clinician layers their own clinical judgment via the narrative fields and Other Comments.
The impression auto-updates whenever you change the observed data, selected reference equation, or narrative fields. Click Copy to Clipboard to paste the impression into your clinical note or reporting system.
Six text fields allow you to document specific aspects of the test. Each field has a 500-character limit.
| Narrative | Buttons | Behavior |
|---|---|---|
| Blood Pressure Response | Generate, Normal | Generate builds a narrative from observed BP at rest, peak, and recovery. Normal inserts standard normal-response text. |
| Oxygen Saturation | Generate, Normal | Generate builds a narrative from observed SpO₂ values. Normal inserts standard normal text. |
| ECG Findings | Normal | Normal inserts standard normal sinus rhythm text. The structured ECG findings from the Exercise tab (atrial tachycardia, ventricular ectopy, ST changes) are also incorporated automatically. |
| Symptoms | Normal | Normal inserts "no symptoms" text. Edit freely to describe patient-reported complaints. |
| Comparison to Prior Tests | (manual) | Describe relevant changes from prior tests. |
| Other Comments | (manual) | Additional observations (e.g., PFT results, special circumstances). |
Narratives are saved automatically when you click or tab out of a
field. They are included in the .pedal file export and
stored in the patient database.
When a patient has more than one exercise test in the database, the Report tab displays trend charts showing changes over time:
Each data point is labeled by test date and plotted in chronological order. The open circle marks the test currently loaded in the editor (which may be a prior study, not the most recent). The chart panel shows a count of tests included and notes any tests excluded for missing date or VO₂.
Reading the Peak VO₂ chart. Hover any point to see the observed peak VO₂ (mL/kg/min and the absolute mL/min value), the right-axis metric (% predicted or Z-score), the reference equation used, and the Z-score when one is available. The reference equation and Z-score appear only on the Peak VO₂ tooltip to keep the other charts uncluttered.
Apply current reference to all tests. Toggle this to recalculate percent predicted or Z-scores for every historical test using the equation currently selected on the Report tab. The reference is recomputed against each test's own age, height, and weight — so a prior test that only stored a pediatric equation still gets a value under the current reference. This is the consistent comparison baseline you need when a patient has aged across a threshold (e.g., from Blanchard to Wasserman). The recalculation is for display only; it never overwrites stored or verified data.
Copy Charts. Click Copy Charts to copy all four comparison charts as a single image to the clipboard, ready to paste into a test report or note.
These charts are useful for tracking exercise capacity over time in patients undergoing serial surveillance (e.g., Fontan patients, post-surgical follow-up).