← Entering CPET Data · Home · Normative Predictions →
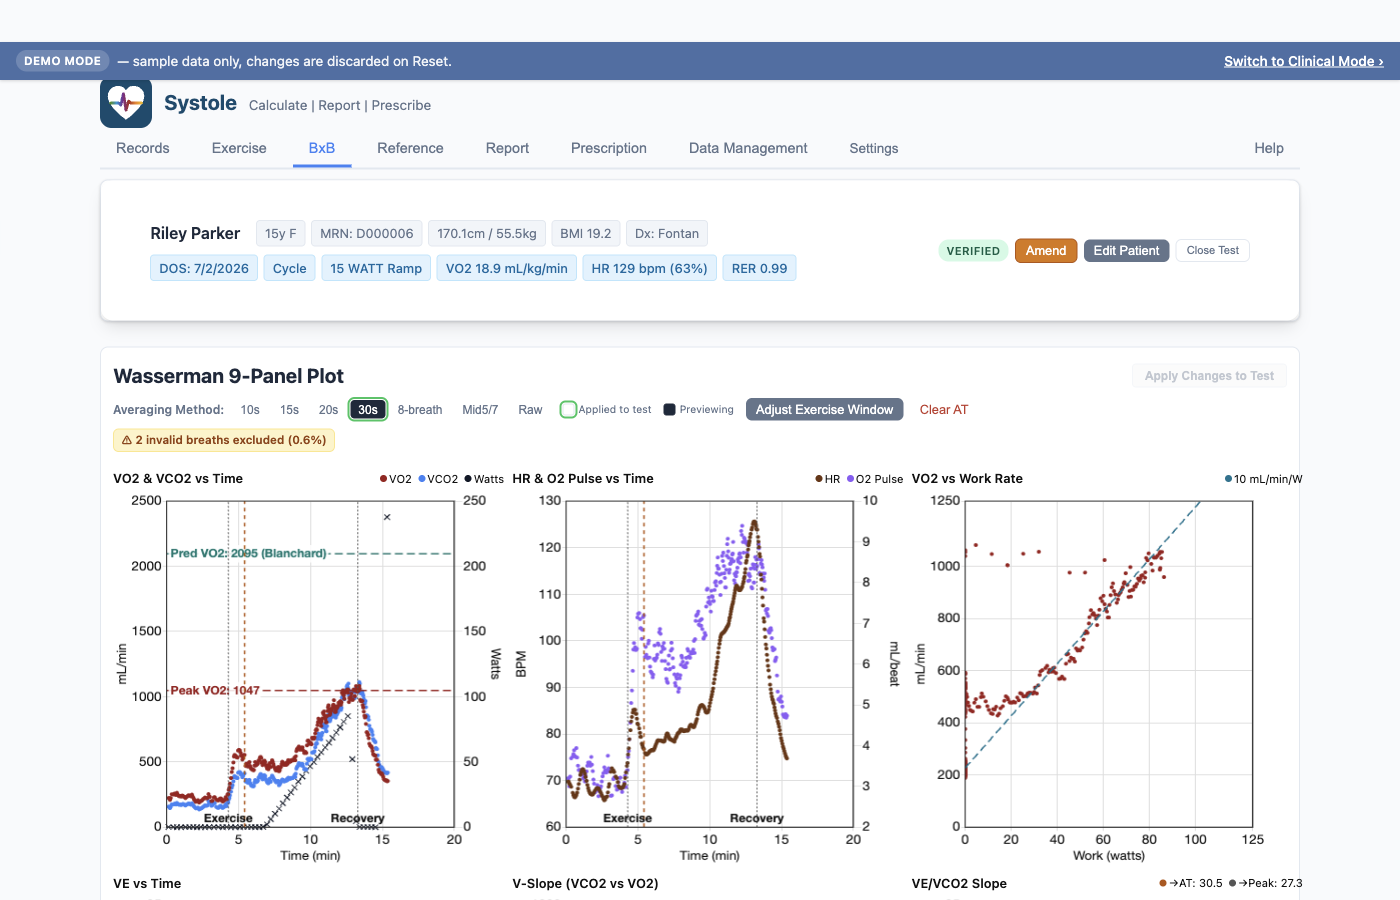
The BxB tab is a dedicated workspace for breath-by-breath CPET data. It hosts the Wasserman 9-Panel Plot and a time-down data table. The tab appears only when the loaded test contains BxB data; otherwise it shows an empty-state message.
BxB data arrives in Systole one of three ways:
.sum file (BxB section).pedal v5.0 fileNine scatter panels arranged in a 3×3 grid:
| Panel | Variables |
|---|---|
| 1 | VO₂ & VCO₂ vs Time |
| 2 | HR & O₂ Pulse vs Time |
| 3 | VO₂ vs Work Rate |
| 4 | VE vs Time |
| 5 | V-Slope (VCO₂ vs VO₂) |
| 6 | VE/VCO₂ Slope |
| 7 | VE/VO₂ & VE/VCO₂ |
| 8 | RER vs Time |
| 9 | PETO₂ & PETCO₂ vs Time |
Phase markers (Exercise / Recovery) appear as vertical reference lines, derived from the source file's testTiming or auto-detected from the BxB stream when missing. Recovery data is trimmed from the V-slope and VO₂-vs-Work panels for clean regression visualization. The horizontal predicted-peak-VO₂ reference line tracks the equation currently selected on the Reference tab.
Panel 3 is the one panel whose angle is the finding, so it does not auto-fit to the data:
On a treadmill there is no measured work rate, so the x-axis is the ACSM estimate back-computed from speed and grade — it is labelled "Work (watts, est.)" and the legend chip's tooltip repeats the caveat. Treat the treadmill relationship as noisier, and partly a reflection of that arithmetic rather than of the patient.
Breath-by-breath data occasionally contains corrupted breaths — a swallow, cough, sigh, partial breath, or sensor dropout produces a single cycle with physically impossible gas exchange (e.g. VO₂ or VCO₂ at or below zero). Because the ventilatory equivalents are ratios (VE/VO₂ and VE/VCO₂), a near-zero denominator makes the value explode — a real example reaches VE/VCO₂ ≈ 27,000 against normal values of 20–50. Left unhandled, one such breath flattens the VE/VO₂ & VE/VCO₂ panel and skews the averaged trace and the reported VE/VCO₂ slope.
No stored breath is ever changed or deleted — the filtering is applied at view/compute time only.
Developer reference for thresholds and rationale:
docs/BXB_ARTIFACT_HANDLING.md.
All edits on the BxB tab are previews held in a working draft until you commit them. The big right-justified Apply Changes to Test button on the title row writes the draft to the test's summary data (Rest / AT / Peak values, VE/VCO₂ slopes, AT timestamp, applied averaging method, and exercise window). Until you click Apply, nothing changes in the test record.
Switching tabs with unapplied changes opens a prompt with three choices: Stay on tab (cancel the switch), Discard & leave (drop the draft and switch), or Apply changes & leave (commit the draft, exactly as the Apply button does, then switch). Clicking Verify with unapplied changes also prompts you to apply or discard.
Seven buttons under "Averaging Method:" select how breaths are smoothed for chart display and summary computation:
Button styling shows the state:
The site-wide default lives in Settings → Default BxB Averaging Method.
Set or adjust AT on the V-slope panel:
AT is captured as both a VO₂ value and a timestamp, so the time-down table highlights the AT row by elapsed time rather than by VO₂ — avoiding spurious matches from transiently high early-exercise values.
Click Adjust Exercise Window to enter draggable mode. Two thick red vertical lines mark exercise start and recovery start; drag either to redefine the exercise phase. Discard Window Changes reverts to the saved markers.
Adjusting the window affects which breaths count as Rest, Exercise, and Recovery for summary computation, AT phase membership, and VE/VCO₂ slope regressions.
Below the 9-panel plot, a tabular view of the BxB stream resampled to fixed intervals (10 s for 20s/30s rolling, 5 s for 10s/15s rolling). Features:
Important: The time-down table values are interpolated for readability and may differ slightly from the Exercise tab summary, which is computed from the dense per-breath rolling average. Peak VO₂ and AT in the 9-panel plot and Exercise tab summary are always exactly consistent.
Download CSV (top right of the Breath-by-Breath Data heading) exports exactly the rows shown in the time-down table — same resampling, same columns, same cycle/treadmill layout — to a CSV file. Two additions make it analysis-ready:
The file is named from the patient and date of service (e.g.
Parker_Riley_2026-07-02_bxb-timedown.csv).
Clicking Apply Changes to Test on the title row commits the working draft. After Apply:
.pedal round-trip) and
the window markers.If Breeze already averaged this test's breath data, the averaging buttons are locked and a note says so — the rows are shown and summarised as exported.
The button is disabled when no draft changes are pending.